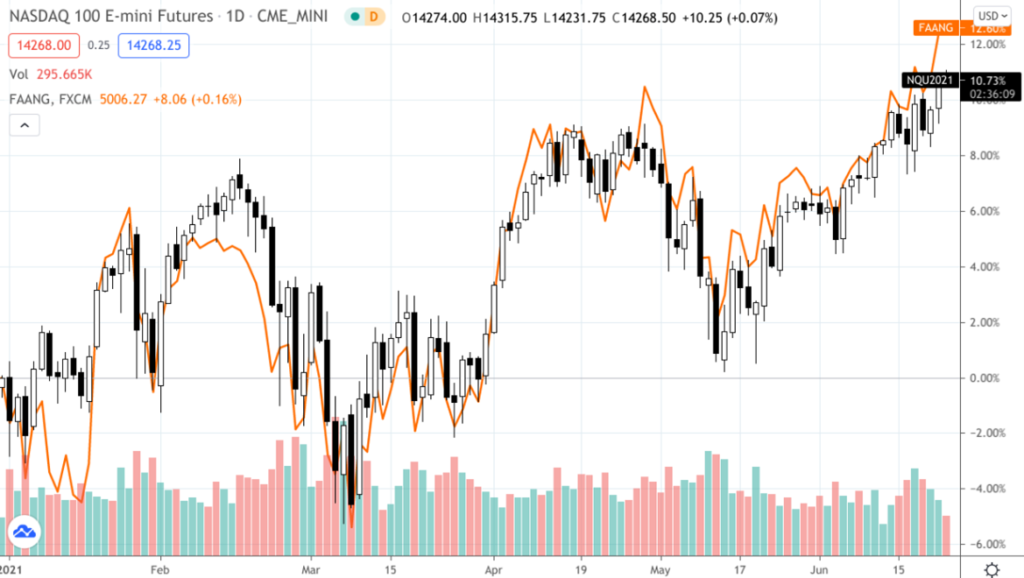
- The Nasdaq 100 futures and FAANG index are tightly correlated.
- However, there are unique differences that investors might want to consider.
- The asset weightings in a portfolio can make big difference when assessing potential market opportunities against risks
When most investors think “FAANG stocks,” the idea that comes to mind is mega-cap American tech. Similarly, when most investors think of “tech exposure,” the index that immediately comes to mind is the tech-heavy Nasdaq 100 (we’ll be focusing on the futures–NQ).
You can get FAANG exposure by trading the Nasdaq 100 (or the NQ), but you can’t get Nasdaq 100 exposure by substituting it with FAANG stocks. Yet the two are highly correlated. When one moves up, so too does the other, and vice versa.
So, how correlated is FAANG to the NQ? What are their similarities and differences? What might make one outperform the other? And which one might be more suitable for trading versus investing?
First, What are FAANG Stocks?
FAANG, a term coined by CNBC’s Jim Cramer back in 2013, is an acronym for Facebook (FB), Amazon (AMZN), Apple (AAPL), Netflix (NFLX), and Google’s parent company Alphabet(GOOG).
All five make up some of the largest companies in the Nasdaq and Nasdaq 100 index. And although not all are categorized under the Information Technology Sector according to Global Industry Classification Standard, or GICS, they’re still, more or less, “tech stocks.”
When analysts refer to these five stocks as FAANG as a benchmark, the stocks are often equally weighted.
Next, What About the Nasdaq-100?
The Nasdaq 100 is an index of 102 securities offered by 100 of the largest non-financial companies in the Nasdaq Index. The index is weighted according to market cap, making the five FAANG stocks dominant among their other 97 peers.
Difference in Trading the Nasdaq 100 Futures versus Outright FAANG Stocks
Currently, there is no exchange-traded fund (ETF) that contains only FAANG. You’d have to purchase the stocks outright, which can be expensive unless you’re able to buy partial shares.
Trading the E-Mini or Micro E-mini Nasdaq 100 futures will give you exposure to FAANG, but you will also have to hold exposure to the other 95 companies. Also, you are exposed to more sectors with the Nasdaq such as Healthcare and Utilities that are not present in the FAANG Index.
As you can see below, the two are highly correlated.
NQ and FAANG Index – Daily Chart – January 1 – June 23, 2021 (Source: Tradingview)

Both are exposed to news and “personality risk.”
Should any FAANG company or company CEO announce something that may create volatility with its stock, you are more exposed to volatile fluctuations if you hold that stock.
As for the Nasdaq, should any industry or sector–not present in FAANG–experience positive or negative volatility, you may see a de-correlation between the two instruments.
The Bottom Line
Although both instruments are highly correlated, you should mind the differences in cost, exposure, and other regulatory factors that may affect your trading and investing goals. You may even consider using one instrument to hedge the other. However you approach it, be sure to examine the unique attributes of each instrument to find which one best matches your financial goals and risk tolerance.
Please be aware that the content of this blog is based upon the opinions and research of GFF Brokers and its staff and should not be treated as trade recommendations. There is a substantial risk of loss in trading futures, options and forex. Past performance is not necessarily indicative of future results.