It’s safe to say that gold has been one of the more confusing assets on Wall Street. A hedge against inflation, gold has been falling despite consumer prices rising. A hedge against the markets? That’s something we have yet to see.
Gold trades as much on sentiment as it does on fundamentals, at least in the near term. The Federal Reserve’s aggressive rate hiking stance has taken some of the glimmer away from the yellow metal. Yet, there’s also a legitimate argument that gold isn’t so much a hedge against inflation as it is a hedge against declining faith in the central bank. That, too, is something we have yet to see, at least in the current context.
So, where is the yellow metal heading? And what are the critical price points to watch out for in the coming weeks?
Technical Analysis:
Gold started the week on the wrong foot, having run into resistance at $1,680 on its way back up. Despite low Treasury yields, resurgent demand for the US dollar, combined with a cautious market tone, weighed on non-yielding bullion.
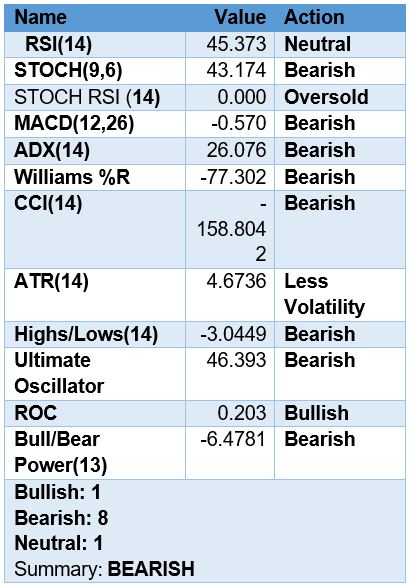
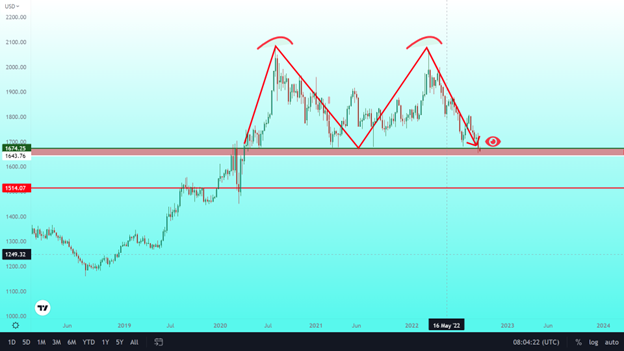
The weekly chart (see figure 1 below) shows a cup and handle formation, and the 14-day Relative Strength Index (RSI) is still below the midline, as well as some other important technical indicators and oscillators. This tells us that the downside bias is still strong.
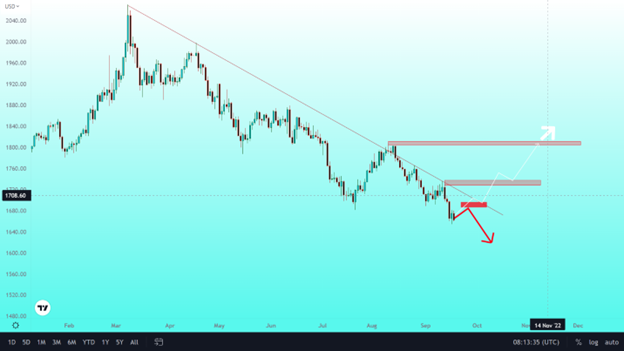
At the same time, the low of $1,655 is regarded as immediate support, below which sellers may seek the psychological level of $1.650. Aside from that, we can see a slightly bullish feel on a daily basis by looking at bullish divergence, which can be deemed a glimmer of hope for bulls. On the way to the $1,575 pattern target, the $1,630 falling trendline support will be tested.
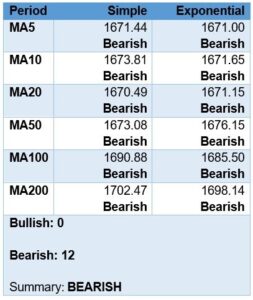
The gold technical analysis results are shown below. Looking at the available data below can help you get a sense of the overall picture and possible next steps.
Technical Indicators and Moving Averages:
Table 1: Moving Averages as of 9/19/22

Table 2: Oscillator & Indicators as of 9/19/22

Figure 1 Weekly Chart- Spot Gold XAU/USD May 2018 to September 15, 2022

Figure 2 Daily Chart – Spot Gold XAU/USD January 7 to September 15, 2022

Fundamental Analysis:
As the US dollar and Treasury yields rose, gold succumbed to pressure from aggressive rate hike expectations.
The next quarterly FOMC meeting, scheduled for September 21, has a 78% chance of a 75bps hike and a 22% chance of a 100bps hike.
In this type of environment, investors are more likely to sell their gold positions than their equities.
For gold to make a significant recovery, the market must see a slowing in rate hikes. And that could happen in the coming months as economic data deteriorates, allowing the Fed to ease off the monetary policy tightening pedal.
Please be aware that the content of this blog is based upon the opinions and research of GFF Brokers and its staff and should not be treated as trade recommendations. There is a substantial risk of loss in trading futures, options and forex. Past performance is not necessarily indicative of future results.
Disclaimer Regarding Hypothetical Performance Results: HYPOTHETICAL PERFORMANCE RESULTS HAVE MANY INHERENT LIMITATIONS, SOME OF WHICH ARE DESCRIBED BELOW. NO REPRESENTATION IS BEING MADE THAT ANY ACCOUNT WILL OR IS LIKELY TO ACHIEVE PROFITS OR LOSSES SIMILAR TO THOSE SHOWN. IN FACT, THERE ARE FREQUENTLY SHARP DIFFERENCES BETWEEN HYPOTHETICAL PERFORMANCE RESULTS AND THE ACTUAL RESULTS SUBSEQUENTLY ACHIEVED BY ANY PARTICULAR TRADING PROGRAM.
ONE OF THE LIMITATIONS OF HYPOTHETICAL PERFORMANCE RESULTS IS THAT THEY ARE GENERALLY PREPARED WITH THE BENEFIT OF HINDSIGHT. IN ADDITION, HYPOTHETICAL TRADING DOES NOT INVOLVE FINANCIAL RISK, AND NO HYPOTHETICAL TRADING RECORD CAN COMPLETELY ACCOUNT FOR THE IMPACT OF FINANCIAL RISK IN ACTUAL TRADING. FOR EXAMPLE, THE ABILITY TO WITHSTAND LOSSES OR TO ADHERE TO A PARTICULAR TRADING PROGRAM IN SPITE OF TRADING LOSSES ARE MATERIAL POINTS WHICH CAN ALSO ADVERSELY AFFECT ACTUAL TRADING RESULTS. THERE ARE NUMEROUS OTHER FACTORS RELATED TO THE MARKETS IN GENERAL OR TO THE IMPLEMENTATION OF ANY SPECIFIC TRADING PROGRAM WHICH CANNOT BE FULLY ACCOUNTED FOR IN THE PREPARATION OF HYPOTHETICAL PERFORMANCE RESULTS AND ALL OF WHICH CAN ADVERSELY AFFECT ACTUAL TRADING RESULTS.