From time to time, in the trading world, you will come across a time-tested strategy that has somehow been forgotten. One such strategy is Toby Crabel’s NR7, a technique introduced in his (now out of print) book “Day Trading with Short Term Price Patterns & Opening Range Breakout.”
Despite the book being out of print, its insights, particularly the NR7 patterns, remain relevant. This pattern, which is similar to the Bollinger Band Squeeze, is based on the idea that periods of low volatility, or narrow trading ranges, can lead to explosive price movements. Let’s take a look.
Understanding the NR7 Strategy – The Basics
The NR7 strategy focuses on identifying the narrowest trading range over a seven-day period. This strategy considers the absolute day’s range – the difference between the high and the low of a trading day – rather than the percentage range.
Identifying NR7 Days

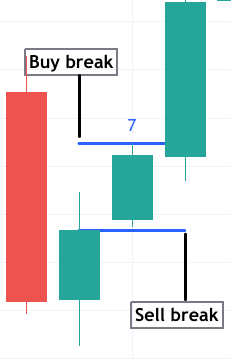
The NR7 day is the day with the narrowest range in the last seven days. This pattern signals a period of consolidation and is an indicator of potential volatility expansion.
Buy and Sell Signals
- Buy Signal: When the price moves above the high of the NR7 day.
- Sell Signal: When the price drops below the low of the NR7 day.
It’s crucial that these signals lead to immediate price movements in the expected direction, as delays or reversals often indicate false signals.
Risk Management
Given the short-term nature of this strategy, Crabel advised quick profit-taking, often within the first profitable close. However, traders can also use resistance levels or percentage targets for profits. For stop-losses, techniques like the Parabolic SAR or training your stops can be used.
Take a look at the example below:
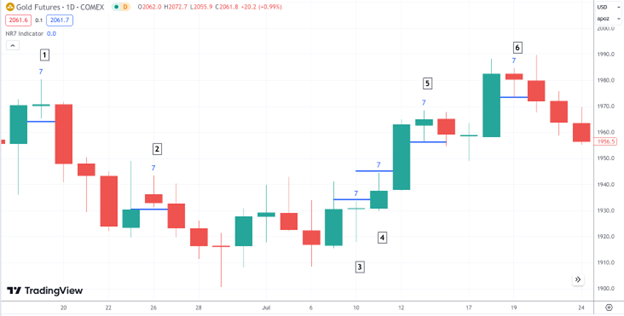
GC – Daily chart – June 15 – July 24, 2023

You can find the NR7 indicator on the chart above – each NR7 day is designated by the number 7 (blue).
Trades 1 and 2, both on the short side, would have yielded strong results depending on when you decided to close your position. Trades 3 and 4, both on the long side, would also have yielded strong results. Trade 5 didn’t work out so well, ending in a small loss. Trade 6, however, might have yielded a favorable result if you held the position for all three consecutive candles. The reason for this is that you might have been stopped out if the upside triggered a long trade before the downside triggered a short trade.
And that brings us to the main risk of this strategy. Sometimes, it may trigger a long position and then a short position, possibly resulting in one unprofitable trade and, in worst cases, a loss on both sides.
The Bottom Line
Crabel’s NR7 trading strategy, rooted in the concept of volatility contraction and expansion, is a relevant strategy for short-term traders. Its simplicity in identifying trading ranges combined with additional indicators for trend and momentum makes it a versatile tool. However, traders should be aware of its inherent risks, like false breakouts and whipsaws, and use it as part of a broader, well-thought-out trading plan. Whether used in its pure form or as a component of a more complex strategy, the NR7 can offer insightful entry points in the ever-changing market landscape.
Please be aware that the content of this blog is based upon the opinions and research of GFF Brokers and its staff and should not be treated as trade recommendations. There is a substantial risk of loss in trading futures, options and forex. Past performance is not necessarily indicative of future results.
Be advised that there are instances in which stop losses may not trigger. In cases where the market is illiquid–either no buyers or no sellers–or in cases of electronic disruptions, stop losses can fail. And although stop losses can be considered a risk management (loss management) strategy, their function can never be completely guaranteed.
Disclaimer Regarding Hypothetical Performance Results: HYPOTHETICAL PERFORMANCE RESULTS HAVE MANY INHERENT LIMITATIONS, SOME OF WHICH ARE DESCRIBED BELOW. NO REPRESENTATION IS BEING MADE THAT ANY ACCOUNT WILL OR IS LIKELY TO ACHIEVE PROFITS OR LOSSES SIMILAR TO THOSE SHOWN. IN FACT, THERE ARE FREQUENTLY SHARP DIFFERENCES BETWEEN HYPOTHETICAL PERFORMANCE RESULTS AND THE ACTUAL RESULTS SUBSEQUENTLY ACHIEVED BY ANY PARTICULAR TRADING PROGRAM.
ONE OF THE LIMITATIONS OF HYPOTHETICAL PERFORMANCE RESULTS IS THAT THEY ARE GENERALLY PREPARED WITH THE BENEFIT OF HINDSIGHT. IN ADDITION, HYPOTHETICAL TRADING DOES NOT INVOLVE FINANCIAL RISK, AND NO HYPOTHETICAL TRADING RECORD CAN COMPLETELY ACCOUNT FOR THE IMPACT OF FINANCIAL RISK IN ACTUAL TRADING. FOR EXAMPLE, THE ABILITY TO WITHSTAND LOSSES OR TO ADHERE TO A PARTICULAR TRADING PROGRAM IN SPITE OF TRADING LOSSES ARE MATERIAL POINTS WHICH CAN ALSO ADVERSELY AFFECT ACTUAL TRADING RESULTS. THERE ARE NUMEROUS OTHER FACTORS RELATED TO THE MARKETS IN GENERAL OR TO THE IMPLEMENTATION OF ANY SPECIFIC TRADING PROGRAM WHICH CANNOT BE FULLY ACCOUNTED FOR IN THE PREPARATION OF HYPOTHETICAL PERFORMANCE RESULTS AND ALL OF WHICH CAN ADVERSELY AFFECT ACTUAL TRADING RESULTS.