The market crash of 2008 was just over a decade ago, so it is still in the recent memory of many investors. It is generally undisputed that the underlying cause of the 2008-2009 bear market is the housing crisis stemming from a massive amount of subprime debt. The subprime loans were repacked–combined with investment grade debt securities–and sold as grade A and above investments to numerous financial institutions which then passed that on to individual investors.
But what actually triggered the fall? Where was the tipping point? Why didn’t the crash happen sooner…or later?
Let’s Look 2 Key Triggers:
It began with the introduction of one accounting rule: FAS 157.
Trigger 1: FAS 157
FAS 157, introduced in November 2007, was a new accounting rule that required financial institutions to value their assets at their current selling price–the price at which they would be sold if they had to be sold immediately. This is called “mark-to-market.”
The problem this caused many financial institutions was that many of their assets–such as mortgage-backed collateral debt obligations and credit default swaps–didn’t have a regular (publicly-traded) market. In other words, there was no clear way to “immediately” price them, as they were highly illiquid.
In the event that there was not a standard market for an asset, the rule then required them to use the last selling price. A major issue arose here because the last price, in many cases, was outdated and differed significantly from the current price. It’s difficult to mark-to-market an asset that has no regular or liquid market. This made smaller firms who held these assets vulnerable should the assets experience declines in value.
So smaller-capitalized firms began “writing down” these illiquid assets, lessening the value of these assets. But then that meant other firms also had to write down similar assets. Firms whose capital ratios fell found themselves in a bind – banks didn’t want to take risks lending them capital.
A fire sale of mortgage-backed debt obligations ensued, their illiquid values falling deeper and deeper. As their values fell, so too did the capital ratios of the institutions that held them, making the institutions themselves short of capital and liquidity.
Trigger 2: Government’s Response to the Crisis
The government’s response to these declines was unpredictable. With Federal Reserve Chairman Ben Bernanke and US Treasury Secretary Henry Paulson at the helm of the crisis management ship, some institutions were saved while others were allowed to fail. Bear in mind also that these mortgage-backed debt obligations were also sold to institutional investors across the globe.
The unpredictability in the Fed’s and Paulson’s response–regarding which institutions were to be saved or left for dead–made it difficult for well-capitalized banks to step in to inject liquidity in the form of loans. So, liquidity dried up, and the fall of the financial sector accelerated, taking down the broader market and economy with it.
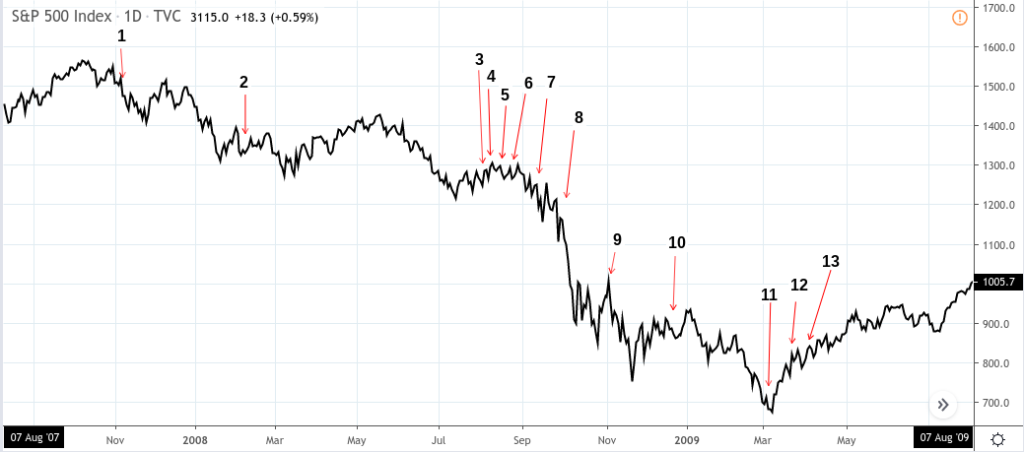
Amidst the macro backdrop of these two events, the market crash unfolds:
S&P 500 Index – August 2007 to August 2009

- FAS 157 is implemented.
- Bear Stearns falls, unable to secure short-term loans.
- Merrill Lynch unloads its CDO portfolio to Lone Star Capital.
- The Federal Reserve bails out AIG.
- Lehman Brothers goes bankrupt, filing Chapter 11.
- Bank of America acquired Merrill Lynch; Morgan Stanley and Goldman Sachs became bank holding companies.
- Washington Mutual falls, seized by the Office of Thrift Supervision.
- TARP is activated–a $700 billion bailout.
- The Fed’s QE1 begins.
- The SEC recommends clarification on FAS 157.
- Market bottom has been reached.
- FASB proposes revising FAS 157.
- FAS 157 revised.
The Bottom Line
For those of us who were affected by it, the 2008-2009 bear market was filled with multiple negative events, deep declines, and optimistic “bear rallies” that made the entire crash confusing. It’s easy to see, given the numerous institutional crashes, how the regular investor or trader might have missed the macro effect that FAS 157 and the government’s response had on the markets and economy.
But all major market events are driven by macro fundamentals. We are in the midst of the longest bull market in history, running from March 2009 to present. And as investors wondering when our current record-setting bull market will end, it behooves everyone to take a look at the bigger forces that might be driving the market events that we see on a daily basis.
Please be aware that the content of this blog is based upon the opinions and research of GFF Brokers and its staff and should not be treated as trade recommendations. There is a substantial risk of loss in trading futures, options and forex. Past performance is not necessarily indicative of future results.
Disclaimer Regarding Hypothetical Performance Results: HYPOTHETICAL PERFORMANCE RESULTS HAVE MANY INHERENT LIMITATIONS, SOME OF WHICH ARE DESCRIBED BELOW. NO REPRESENTATION IS BEING MADE THAT ANY ACCOUNT WILL OR IS LIKELY TO ACHIEVE PROFITS OR LOSSES SIMILAR TO THOSE SHOWN. IN FACT, THERE ARE FREQUENTLY SHARP DIFFERENCES BETWEEN HYPOTHETICAL PERFORMANCE RESULTS AND THE ACTUAL RESULTS SUBSEQUENTLY ACHIEVED BY ANY PARTICULAR TRADING PROGRAM.
ONE OF THE LIMITATIONS OF HYPOTHETICAL PERFORMANCE RESULTS IS THAT THEY ARE GENERALLY PREPARED WITH THE BENEFIT OF HINDSIGHT. IN ADDITION, HYPOTHETICAL TRADING DOES NOT INVOLVE FINANCIAL RISK, AND NO HYPOTHETICAL TRADING RECORD CAN COMPLETELY ACCOUNT FOR THE IMPACT OF FINANCIAL RISK IN ACTUAL TRADING. FOR EXAMPLE, THE ABILITY TO WITHSTAND LOSSES OR TO ADHERE TO A PARTICULAR TRADING PROGRAM IN SPITE OF TRADING LOSSES ARE MATERIAL POINTS WHICH CAN ALSO ADVERSELY AFFECT ACTUAL TRADING RESULTS. THERE ARE NUMEROUS OTHER FACTORS RELATED TO THE MARKETS IN GENERAL OR TO THE IMPLEMENTATION OF ANY SPECIFIC TRADING PROGRAM WHICH CANNOT BE FULLY ACCOUNTED FOR IN THE PREPARATION OF HYPOTHETICAL PERFORMANCE RESULTS AND ALL OF WHICH CAN ADVERSELY AFFECT ACTUAL TRADING RESULTS.