Smaller time frames tend to magnify a market’s volatility.
If there is something that day traders and swing traders know all too well, it’s that the markets can be very noisy. This is particularly the case when it comes to short-term trading. There are lots of volatile price movements, all of which show market participants speculating on an asset’s market value and “true” direction, whether upward or downward.
Financial technology developers have created numerous tools and indicators to help traders “cut through the noise” and simplify complex market movements. The problem is that there are now at least 100 different indicators. And their readings may often compete or conflict with one another. There is no indicator that is 100% accurate…not even close to it.
In a complex and volatile market, sometimes less is more.
When it comes to a price movements, what if we take a simpler approach and break things down into just 3 categories?
- Price appears to be trending upward;
- Price appears to be trending downward; and
- Price doesn’t appear to be trending at all.
Let’s use this less is more approach and apply it to current Crude Oil prices.
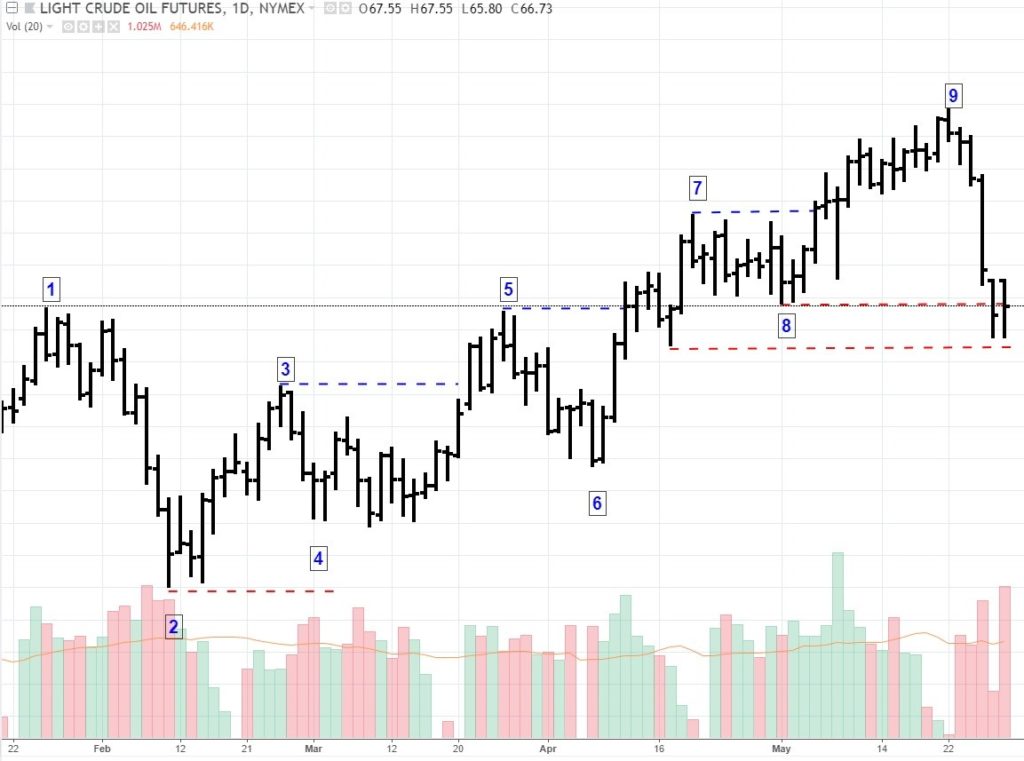
Simple swing-high and swing-low approaches to the Crude Oil market are shown in the chart below:

(Crude Oil Daily Chart – January 22, 2018 to May 29, 2018).
On January 25 of this year, Crude Oil (CL), reached a relative high point following an uptrend that had begun in June 2017. (1) marks this relative “top” and (2) marks the swing-low point following the top.
Why did we call this a top? Because in February, the price at (3) failed to break above the January swing-high point. Hence, we drew a line below (2).
If you’re not familiar with the basic rule of trend, here’s a brief summary: an uptrend is defined by higher highs and higher lows; likewise, a down trend is define by lower highs and lower lows.
So if the market were to trend upward, it would have to break above (1) while not moving below (2). If the market were to reverse, price would have to break below (2) while not violating the high at (1).
If prices fail to do either–if prices stay between the two critical price point, or if they violate both price points, then the market is no longer trending (based on this principle).
But as you can see, price at (4) did not break below the previous support and broke above (3).
Another swing-high was formed (5) and a “higher low” formed at (6). Following our basic rule, an upward trending market would have to break above the previous swing-high, which it did three trading sessions later.
A new swing-high was formed at (7) followed by a higher swing-low seven trading sessions later at (8). Crude oil broke out above (7), topping at (9). Over the last week, Saudi Arabia and Russia signaled the possibility of restoring crude oil output, increasing global crude supply. This commentary may have been the primary fundamental trigger that caused crude oil prices to fall.
As you can see in the chart, prices violated support at (8), rebounding from a lower price point. According to the price action principles demonstrated in this article, when previous support has been broken, it puts into question the direction of the trend. Right now, geopolitical fundamentals are driving the crude oil market, and the current tone favors a decline, which is reflected in the current price action. But the current decline also depends on whether Saudi Arabia and Russia follow through in restoring crude oil output. We’ll have to see what happens next.
Here’s the takeaway: there are times when sophisticated trading indicators and tools may come in handy. But if you are attempting to trade the trend, rather than trading against it, sometimes following simple trend principles to gauge trend direction may be even more useful than the most sophisticated indicators.
For more trend trading education, check out our article Tips for Identifying a Trending Market.